 Code of Conduct
 Ethical Mgmt
 Speak-up Culture
 Latin America
 Asia Pacific
 FX Global Code
 Financial Services
 North America
 Europe
 Middle East
 MSBs
 FinTech
 Insurance
 Investing
 Casinos
 Retail Banks
 Manufacturing
 U.S. National
 Canada
 California
 New York
 Illinois
 Connecticut
 Maine
 Delaware
 Retail
 Warehouse
 Healthcare
 Animated
 Billing & Revenue
 IT & Admins
 Leadership
 Ontario
 British Columbia
 UK Induction
 Australia & NZ
 Workplace Violence Prevention
 Canada
 Italy
 Active Shooter
 AI & Workplace
 Corporate Ethics
 Whistleblower
 Gvmt Contracting
 Export Controls

It’s the night before your quarterly board meeting. Someone on the leadership team wants to know which departments are behind on code of conduct training, how that compares to last year’s data, and whether that’s normal for a company like yours. So you’re at your desk exporting three reports and getting frustrated building a pivot table in Excel.
The DOJ asked a fair question in its 2024 Evaluation of Corporate Compliance Programs: “How do the assets, resources, and technology available to compliance and risk management compare to those available elsewhere in the company?” (source)
Only 22% of ethics and compliance teams have broadly adopted AI compared to the other departments within their organizations (source). There is an opportunity for compliance teams to close that gap, starting with the reports presented in your quarterly board meetings.
Where reporting breaks down
Your data lives in too many places. Training completions sit in one system, hotline and case data in another, and disclosures in a third. Pulling each data set and turning it into something sensible in Excel can eat up hours before you’ve answered a single question.
The questions always come from above. The board wants to know: are we in good shape? Answering that usually means stitching data together by hand.
Numbers without context fall flat. Say employees keep missing the same knowledge check question in your conflicts of interest course. Is that a gap in your training or does every company in your industry struggle here? Without a benchmark, you’re guessing.
The last mile is formatting. Even once you have the numbers, you still need to make them presentable. That’s more time spent resizing charts in Excel.
Bringing AI to compliance reporting
The DOJ is encouraging compliance teams to leverage technology that is available elsewhere within organizations (source). Compliance reporting is a natural next step, and that’s where AI Analytics comes in.
Of course, when the numbers are headed to your board, “trust me” won’t cut it. So Ethena launched AI Analytics to empower you to answer questions that come up in your board meeting:
- Grounded in your compliance data. Every answer is built from your organization’s compliance and training records.
- See the numbers behind every chart. Spot-check results that appear in a table or download them as a CSV.
- You decide what goes to the board. AI handles the busy work. You review every dashboard before it leaves your desk.
Even better, you don’t have to wait until the night before. Build a custom dashboard that tracks the metrics your board cares about over time, so you can walk into every meeting feeling confident in the numbers.
Ask questions in plain English
Type a question, get an answer, and turn it into a chart or dashboard you can come back to.
A few prompts to try:
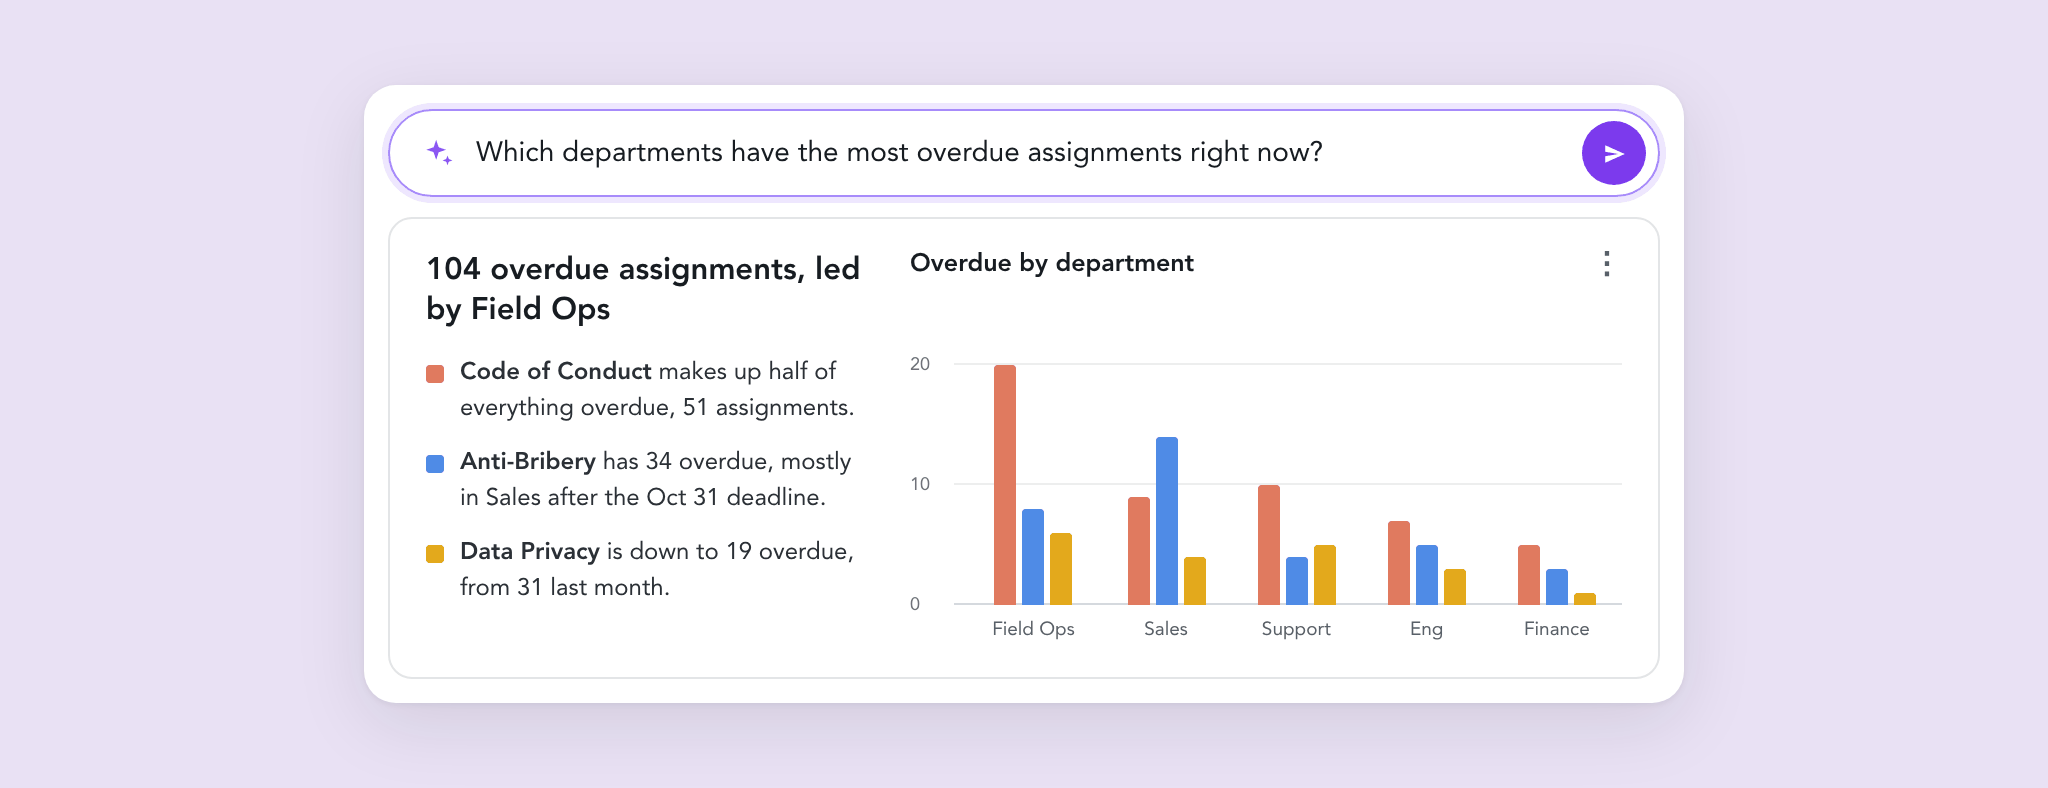
Which departments have the most overdue assignments right now?Show me code of conduct completion rates for our team based in France.How many reports over the last 12 months were about financial misconduct?Build a dashboard I can share with our board every quarter.Experiment with data at your own pace. Ask a follow-up question, change the view, and save what’s useful. See how it works.
12 dashboards, ready on day one
Don’t want to start from a blank slate? AI Analytics launches 12 standard dashboards built around the compliance questions we hear most. Open one, filter it to your needs, and you’re done.
When it’s time to present to your leadership team or board, export. Save the dashboards you present every quarter and pull fresh numbers whenever you need them.
See how you stack up against your peers
Benchmarks are a board reporting staple. According to Ethisphere’s 2026 E&C Metrics and Reporting Guide, built on World’s Most Ethical Companies data, 97% of organizations include program benchmarking findings during their board meetings (source).
Ethena now offers peer benchmarking, including comparisons within your industry. Now, when someone asks “is that good?” during your next quarterly board meeting, you’ve got a real answer based on companies similar to you.
See it on your own data
Skip the late night at your desk before next quarter’s board meeting. Ask your questions, check it against your peers, and export a board-ready dashboard with your logo already on it. Then close your laptop. Your board-ready dashboards will be waiting in the morning.
Curious what your data can tell you? Let’s talk.